
A Year of Patent Filings, Packed With Surprises: Patent Cooperation Treaty 2024
Newsletter Issue 61: Global patents filings by the numbers. Inside the latest WIPO's PCT review.


The latest global patent report is out, published by the World Intellectual Property Organization (WIPO). It offers a clear look at who is filing the most patent worldwide, which technologies are in demand, and where innovation is growing or slowing down.

Millions of Filings, But a Slower Climb
The international patent system recently hit a headline-grabbing figure: five million applications filed under the Patent Cooperation Treaty (PCT) since its creation in 1978.
This milestone, reached in 2024, might appear to suggest an unstoppable tide of innovation and ambition coursing through the global economy.
Yet, the mood at the back of the room is a little subdued.
Beneath the celebration lies a narrative that is slightly less enthusiastic: the rate of growth in international patent applications is not what it used to be. In fact, it is slowing.
According to the World Intellectual Property Organization WIPO’s PCT Yearly Review 2025, 272,600 international applications were filed in 2024, marking a 1.8 percent increase over the previous year.
That figure would normally be considered a decent year.
Given that the average annual growth between 2000 and 2020 hovered around 5.6 percent, this recent number starts to feel a bit underwhelming.
The high point came in 2021, when the system saw a 3.7 percent jump. That was followed by a modest 0.6 percent in 2022, then a more hopeful 1.2 percent in 2023. The 2024 numbers continue this pattern of deceleration.
Now, it is not all a cautionary tale. China still carried the weight of the international system, with 70,015 applications filed in 2024, accounting for over one-quarter of the global total.
The United States followed closely with 55,678 filings, and the Republic of Korea secured a respectable third place with 22,288.
Japan and Germany rounded out the top five.
These countries alone accounted for nearly 80 percent of all PCT filings, which says a lot about both concentration and commitment.
Even among these leading countries, growth was mostly tepid, with some seeing declines. For instance, Japan recorded a 2.2 percent drop in filings, and China’s increase was a minimal 0.6 percent.
The slight uptick in 2024 is largely attributable to stronger growth in a few middle-income economies.
Türkiye, India, South Africa, and Brazil all saw noticeable increases. South Africa, for example, posted a striking 32.5 percent rise in filings, albeit from a smaller base.
These countries are making their presence felt in a space traditionally dominated by the large economies of the OECD.
Their growing engagement with the PCT process reflects an increasing interest in cross-border protection, particularly as domestic innovation systems begin to mature.
Yet, despite the good news from emerging regions, the overall pattern suggests a tapering of growth energy in the international patent system. This does not mean innovation is slowing.
It might mean that more inventors are focusing on domestic filings or relying on regional systems.
It could also mean that the cost and complexity of international protection is forcing some applicants to reconsider the value proposition.
Still, it is worth pausing on that five million mark.
It represents over four decades of accumulated technical knowledge, legal drafting, strategy, competition, and collaboration.
It also highlights the continued relevance of the PCT as the backbone of international patent cooperation.
While the curve might be concerning, the volume is still impressive.
Every year, hundreds of thousands of applicants choose to engage with a system that is notoriously procedural, reasonably costly, and stubbornly time consuming.
That suggests more than mere administrative habit. It demonstrates enduring demand.
The trick, as always, lies in balance. The system must remain efficient and responsive, without overwhelming users with complexity.
The slight deceleration in growth may be exactly what administrators need to reassess pressures on examining offices, procedural timeframes, and legal certainty.
In the meantime, the five million mark stands as a testament to a system that has earned its place. Slow growth or not, it continues to deliver.
Who Filed the Most Patents?
According to the Patent Cooperation Treaty Yearly Review 2025, China once again filed the most international applications in 2024, registering 70,015 filings under the PCT system.
That is a 0.6 percent increase from the previous year, which might not seem particularly dramatic, but when you are already in first place, any growth is a gentle reaffirmation of staying power.

The United States took second place with 55,678 applications. That figure actually represents a 1.1 percent decline compared to the previous year, but it still reflects the country's substantial ongoing participation in the global patent system.
The Republic of Korea continued its consistent rise, taking the third position with 22,288 filings, growing by a healthy 2.4 percent.
It has been a steady climb for Korea over the years, and its continued ascent suggests long-term investment in cross-border technology protection and a strong international outlook among its applicants.
Following them were Japan with 21,473 filings and Germany with 16,916. Japan recorded a decline of 2.2 percent and Germany a drop of 3.3 percent, which might raise eyebrows but probably does not yet warrant panic.
Both countries still remain central figures in the international IP world.
However, a closer look reveals that more middle-income economies are beginning to nudge into the conversation.
India, for instance, filed 3,725 applications in 2024, an 18.2 percent increase from the previous year.
Türkiye also saw a notable rise of 19.7 percent, with 2,186 filings.
South Africa posted a surprising 32.5 percent increase, although from a smaller base.
Brazil continued its growth streak with a 7.9 percent rise.
These figures, while numerically modest compared to China or the United States, reflect expanding interest in global patent strategies from countries that were previously not central to the PCT narrative.
Collectively, the top five countries, China, the United States, Korea, Japan and Germany, accounted for nearly 80 percent of all patent filings in 2024. This concentration is both a strength and a limitation.
It shows where innovation is most heavily protected internationally but also highlights the unequal distribution of resources and filing capacity.
The growing figures from other economies indicate that the gap may slowly begin to narrow as more countries build legal and institutional frameworks to support cross-border IP rights.
It is also interesting to note that while the headline numbers often focus on country totals, the internal structure within each country matters just as much.
In China, many of the filings come from large corporates and research institutions that are investing aggressively in international portfolios.
The United States sees a more diversified filing base that includes universities, startups, and established technology firms.
Korea benefits from both government policy support and strong private-sector engagement.
The international patent system is still very much dominated by a handful of countries, but the edges are beginning to expand.
The 2024 figures hint at a more pluralistic system in the future, where filings come from a broader set of economies and sectors.
Where Innovation Is Concentrated
Patent activity remains squarely in the domain of digital communication, electrical machinery, computer technology, and measurement systems.
These four technical fields collectively accounted for nearly one-third of all international patent applications filed under the Patent Cooperation Treaty.
According to the PCT Yearly Review 2025, the dominance of these sectors reflects both long-term investment and short-term urgency across industries that are constantly upgrading, recalibrating, and seeking new ways to gain legal exclusivity in high-demand areas.

Digital communication held the top spot once again, drawing in the highest number of PCT applications for the third year in a row.
The field includes technologies behind wireless networks, data transmission systems, satellite communications, and mobile infrastructure.
As fifth-generation mobile networks continue to expand and sixth-generation technology starts entering the vocabulary of research labs, the rush to protect these innovations is far from quiet.
The sheer breadth of applications in this space, from protocols to hardware, ensures it remains one of the most patent-heavy fields globally.
Electrical machinery and energy technology was the second most popular area, with a strong showing that speaks to both industry reinvention and environmental pressures.
From energy storage systems and power generation to smart grid tools and electric mobility solutions, the filings suggest that inventors are focused on efficiency, reliability, and increasingly, sustainability.
There is a clear push to make systems cleaner and smarter, but also deeply integrated with digital infrastructure.
Computer technology retained third place. This is no surprise, as software continues to influence almost every sector.
Artificial intelligence, machine learning, and data management tools remain highly contested territories in the patent system.
However, the field also includes more practical innovations in hardware and system-level computing, which are less glamorous but often more patentable.
The majority of filings still concern functions tied to computation, storage, and system optimization, where technical effects are easier to demonstrate.
Measurement technology came in fourth, revealing the growing importance of precise data collection and sensor-based systems across disciplines.
Whether in healthcare, manufacturing, or environmental monitoring, the focus on measurement shows that industries are not only producing but also quantifying at ever finer scales.
This technical field may lack the splashy appeal of more visible consumer technologies, but its importance is no less significant in global filings.
Geographically, the Asia region is dominant.
China, the Republic of Korea, and Japan together generated a considerable share of applications in these top technical fields.
European countries contributed strongly in electrical machinery and medical technologies, while the United States remained prominent across all categories, particularly in computer and digital communication sectors.
The dominance of a few countries across multiple sectors is not a coincidence. It reflects long-term investment in research infrastructure, education, industrial capacity, and, perhaps most importantly, legal familiarity with patent systems.
The Review also noted increased activity in fields such as medical technology, biotechnology, and pharmaceuticals, although these sectors still trail behind the leading four.
Still, their presence shows consistent interest in health-related inventions, especially given global demographic changes and heightened sensitivity to public health preparedness.
It is worth noting that biotechnology, while growing slowly as an industry, is still constrained by regulatory complexity and different national attitudes toward patent eligibility, which might limit international filings in some aspects.
The data shows that technical specialization matters more than ever.
Countries and companies are targeting specific niches where they feel confident in their capacity to deliver and defend.
Top Applicants by Sector
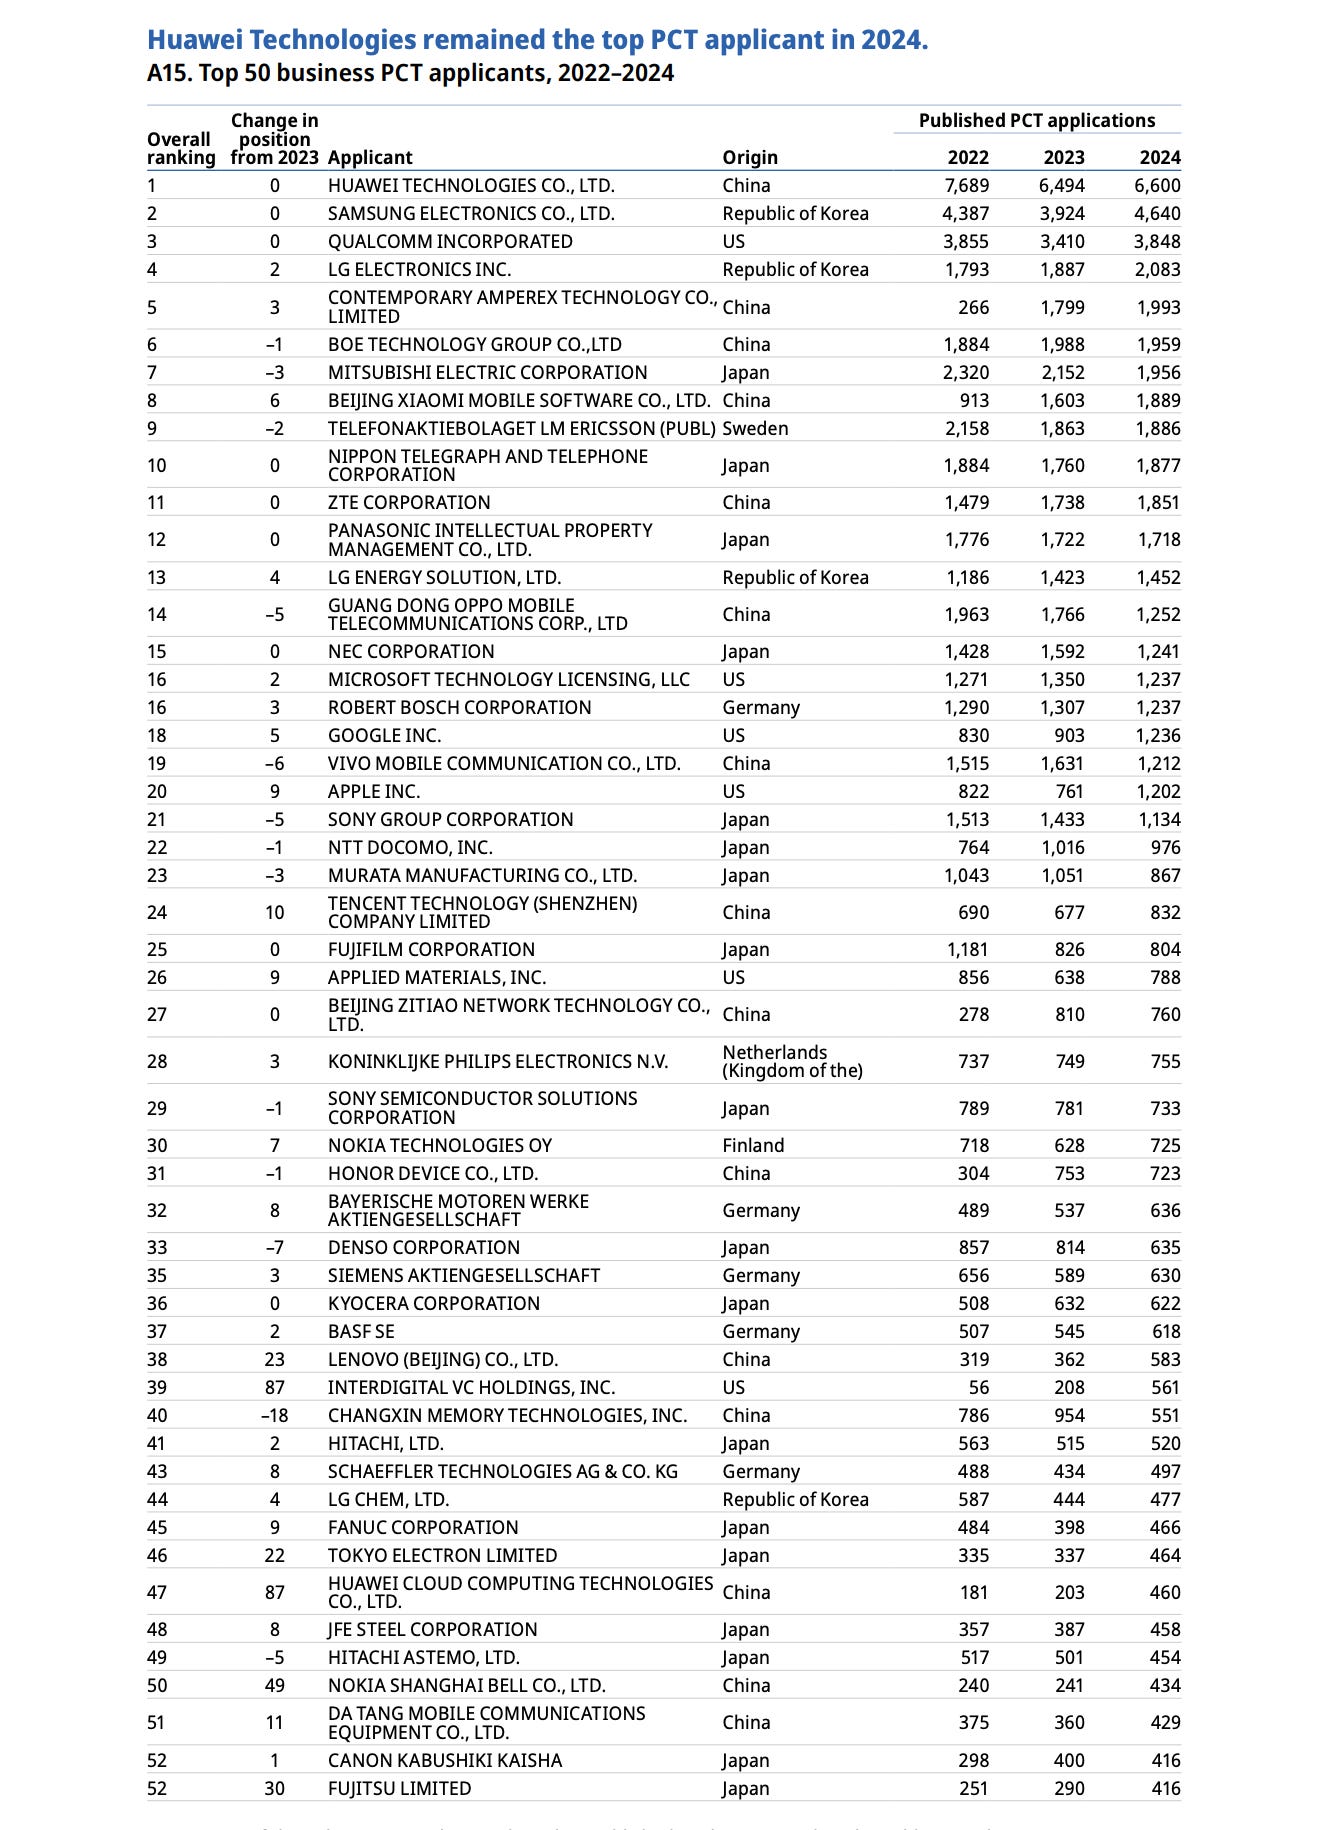
Once again, the front-runner was Huawei Technologies, filing an impressive 6,494 international patent applications. Yes, they have kept their crown, and they did not even look particularly out of breath while doing so.
Samsung Electronics came in second with 3,924 filings, which still represents a major effort, although it is nearly half the volume of Huawei’s total. Qualcomm secured third place with 3,410 filings.
These three companies have consistently sat at the top of the table, and they clearly understand the value of securing early international protection for their inventions.

The sheer volume of filings suggests a very active internal intellectual property strategy, likely supported by entire teams dedicated to PCT filings, jurisdictional analysis, and legal enforcement preparation.
Interestingly, the list also includes several Asian and European tech manufacturers, including Mitsubishi Electric, LG Electronics, Sony, and Ericsson.
These are firms with large R&D operations and deep catalogues of technical inventions, particularly in fields like electrical machinery, semiconductors, digital communication, and consumer electronics.
Their presence in the top ten is consistent with the trend of long-term investment in international patent portfolios as a form of both competitive advantage and risk management.
Outside the corporate sphere, the university and public research institution sector provided some modest but impressive performances.
The University of California led this category with 551 applications.
Zhejiang University followed closely with 309 filings, while China’s Shenzhen University and the Massachusetts Institute of Technology also made strong appearances.
These public institutions represent a unique slice of the global IP picture.
Their patents often emerge from basic research, government-backed innovation schemes, or research-industry partnerships.
While their filing numbers may not rival those of Huawei or Samsung, their focus is often more specialised and typically reflects the strength of their internal technology transfer offices and the legal advice they receive on IP commercialisation
Looking across sectors, it becomes clear that the PCT system is still most heavily used by entities with significant resources, structured IP policies, and a need to protect technology across multiple jurisdictions.
Companies operating in fiercely competitive sectors like telecommunications and semiconductors continue to dominate.
Meanwhile, research institutions are increasing their visibility, not necessarily to build licensing empires but to secure downstream commercialisation pathways and maintain institutional credibility in competitive grant environments.
Inventors and Inclusion
The question of who gets named as an inventor offers a more human metric. Behind each filing, there is a person, or often several, who spent months, maybe years, puzzling over technical problems, tinkering with prototypes, or writing code.
So it becomes rather important to ask who is participating in this process and, in particular, who is being recognised.
The PCT Yearly Review 2025 sheds some useful light on the matter, and while the picture is improving, it remains uneven.
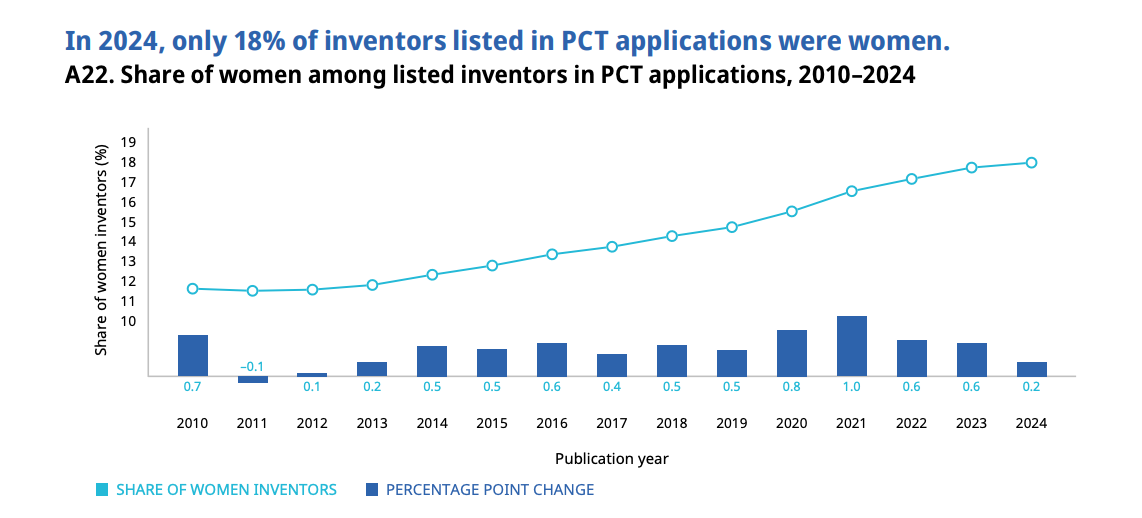
According to the latest statistics, the share of international patent applications that included at least one woman inventor reached 19.8 percent in 2023. That figure represents a marginal increase from 19.5 percent in 2022.
While it is tempting to celebrate at this progress, the reality is that this rate of change would probably not impress anyone who has ever sat through a diversity audit.
The overall pace remains slow, and the inclusion of women in global innovation systems is still lagging behind broader professional and educational trends
That said, there are some encouraging signals hidden in the data.
The Republic of Korea topped the chart among the top ten origins of PCT applications, with women named as inventors in 30.1 percent of all filings.
China followed at 28.8 percent, and France came in third at 27.6 percent.
These figures are significantly above the global average, and they reflect national contexts where policy frameworks, education systems, and corporate initiatives may be playing a more active role in promoting inclusive participation.
At the other end of the range, Japan recorded only 11.6 percent of applications with at least one woman inventor.
Germany and the United States also hovered around the lower end of the spectrum.
These numbers raise questions about pipeline effects, institutional bias, and the structure of innovation ecosystems in each country.
In some contexts, highly technical sectors such as electrical engineering or computer systems, fields with traditionally low female representation, are also the ones generating the most patents, which might explain part of the gap.
The Review also includes sector-level breakdowns.
Fields like biotechnology and pharmaceuticals report higher inclusion rates, which makes sense given the stronger gender balance in life sciences generally.
In contrast, electrical machinery and computer technology continue to reflect the same disparities seen in their underlying workforces.
So while the overall figures may disappoint, they also map neatly onto broader industry patterns and national institutional behaviour.
One might expect that with the rise of interdisciplinary teams, collaboration platforms, and global innovation partnerships, there would be greater diversity in inventor profiles.
However, the evidence suggests that the same underlying professional structures that guide hiring, promotion, and project leadership are mirrored in patent filings.
Inventorship, after all, is not a random event. It is usually the result of structured collaboration, documented contributions, and clear criteria for inclusion.
While there is always a legal standard to apply, the practical reality is that gatekeeping still occurs.
This reality is not purely a moral or social concern. There are real economic consequences to the underrepresentation of women and other groups in the patent system.
It affects who participates in innovation-based industries, who benefits from IP-related income, and who gets access to commercialisation pathways.
These figures point to barriers that are procedural, cultural, and often invisible to those working within dominant institutional norms.
Ultimately, the patent system does not exist in a vacuum. It reflects the broader innovation economy and often magnifies its imbalances.
The slow but steady increase in participation by women inventors is a sign that progress is possible, even if it is being measured in inches rather than miles.
If inclusion is to become something more than a periodical statistic, there will need to be more coordinated action across education, employment, funding, and legal recognition.
TL;DR
Global Filing Volume Plateaued: In 2024, PCT filings reached approximately 273,900 applications, marking only a 0.5% increase year over year. This modest growth continues a plateau observed since 2020, with global pressures from the pandemic, supply chain disruption, inflation, and geopolitical tensions slowing what had been a steady upward trend.
Five Million Cumulative Filings Milestone: WIPO celebrated the publication of the five millionth PCT application in 2024, filed by Samsung in electrical engineering. Although it reflects decades of sustained activity, the time taken between each million—five, four, and three million—has recently shortened, raising questions whether the system has reached a natural ceiling.
External Factors Pressured Filings Since 2020: Global disruptions, COVID‑19’s aftermath, inflation, interest rate hikes, and supply chain hiccups, combined with geopolitical instability and shifts in national industrial policies, have caused filings to stagnate, interrupting the system’s once-robust growth between 2000 and 2020.
Technology Focus: Digital Communication Tops: Digital communication rose to 10.5% of all PCT filings in 2024, surpassing computer technology (9.7%) for the first time. Electrical machinery (8.6%) and medical technology (6.5%) followed. Only these top three plus transport (0.6%) showed growth, highlighting shifting innovation priorities.
Narrow Range of Growing Fields: Out of the top ten technology sectors, only digital communication, electrical machinery, and transport registered growth in 2024. All other key sectors remained flat or declined. This suggests inventors are focusing efforts where returns seem strongest within the PCT ecosystem.
Women Inventors: Small Progress: By the end of 2023, women were listed in 18% of PCT applications, a marginal 0.2 percentage point rise. Although slowly improving, this still leaves gender representation far below parity and is an ongoing concern for inclusive innovation.
Strong Share of Non‑Resident National Filings: In 2023, 57.4% of patent applications entering national phase filings were by non-resident applicants. This shows the PCT’s continued role in facilitating international IP rights across borders.
Filing Origins: Still Concentrated: Applications originated from 124 countries in 2024, a slight drop. Northeast Asia, driven largely by China, Korea, Japan, and electrical engineering have long dominated filings. Even so, the stagnation phase could shift if emerging markets increase participation.
System Maturing vs Temporary Dip: The review suggests that PCT activity may be plateauing as a mature system, rather than merely dipping temporarily. However, history shows that new technologies and policy changes can revive momentum. Thus, caution is urged when interpreting the current slowdown.
Thanks for reading this newsletter. If you found something useful, surprising, or mildly infuriating, feel free to reply and share your thoughts. We always welcome feedback and questions. Your insights help keep this newsletter both informed and occasionally entertaining.
What is your take on the slow pace of growth in global patent filings? Do you see it as a cost issue, a policy gap, or simply a mentality in how innovation is protected today? I am curious to hear how others interpret this change in momentum.
What a fantastic article! One data here shows a low percentage of women listed as inventors. If you work in tech, research, or academia, I keep wondering what practical steps can help to actually increase recognition and inclusion? I would love to gather ideas and experiences that go beyond just awareness (lip service) into action.